Project: Antarctic surface mass balance and surface melt
Alignment with ASP projects:
- Project 1 Objective 3: Future response and Projections
- Project 3 Objective 1: Climate Effects on Terrestrial Habitats and Biogeography
Hub Contributors Nick Golledge, Yaowen Zheng, and Alexandra Gossart
The aim of this project is to study the variability, both spatially and temporally, of surface mass balance and melt at the surface of the Antarctic ice sheet. Surface melt is important because it impacts the health of the firn layer and plays a role in surface mass balance. Additionally, it can also play a role in ice shelf hydrofracturing and instability. Several tools are used to estimate melt over Antarctica and encompass, among other things, spaceborne observations, temperature-melt dependence models and surface energy balance models.
Within this project, we:
- Use a positive-degree-day model to explore the surface melt in Antarctica from 1979 to 2022. This model is statistically parametrized and relies on two main parameters: a temperature threshold and a melt factor. The input only consists in 2m temperature and is calibrated using the satellite melt occurrence products from satellite data, as well as the melt rates from the RACMO2.3 climate model. The novel cell-level positive degree-day model, is parameterized spatially by minimising the error and we find that:
- the PDD model has the ability to capture the main spatial and temporal features for a majority of cells in Antarctica, under a range of melt regimes
- the PDD lacks the ability to accurately capture melt if it arises from effects such as föhn winds or atmospheric rivers that are not reflected in the input ERA5 2-m temperature fields used to force the calculations
- the PDD estimates change analogously to the variations in the training data with steady statistically significant correlations, suggesting the applicability of the PDD model to warmer and colder climate scenarios.
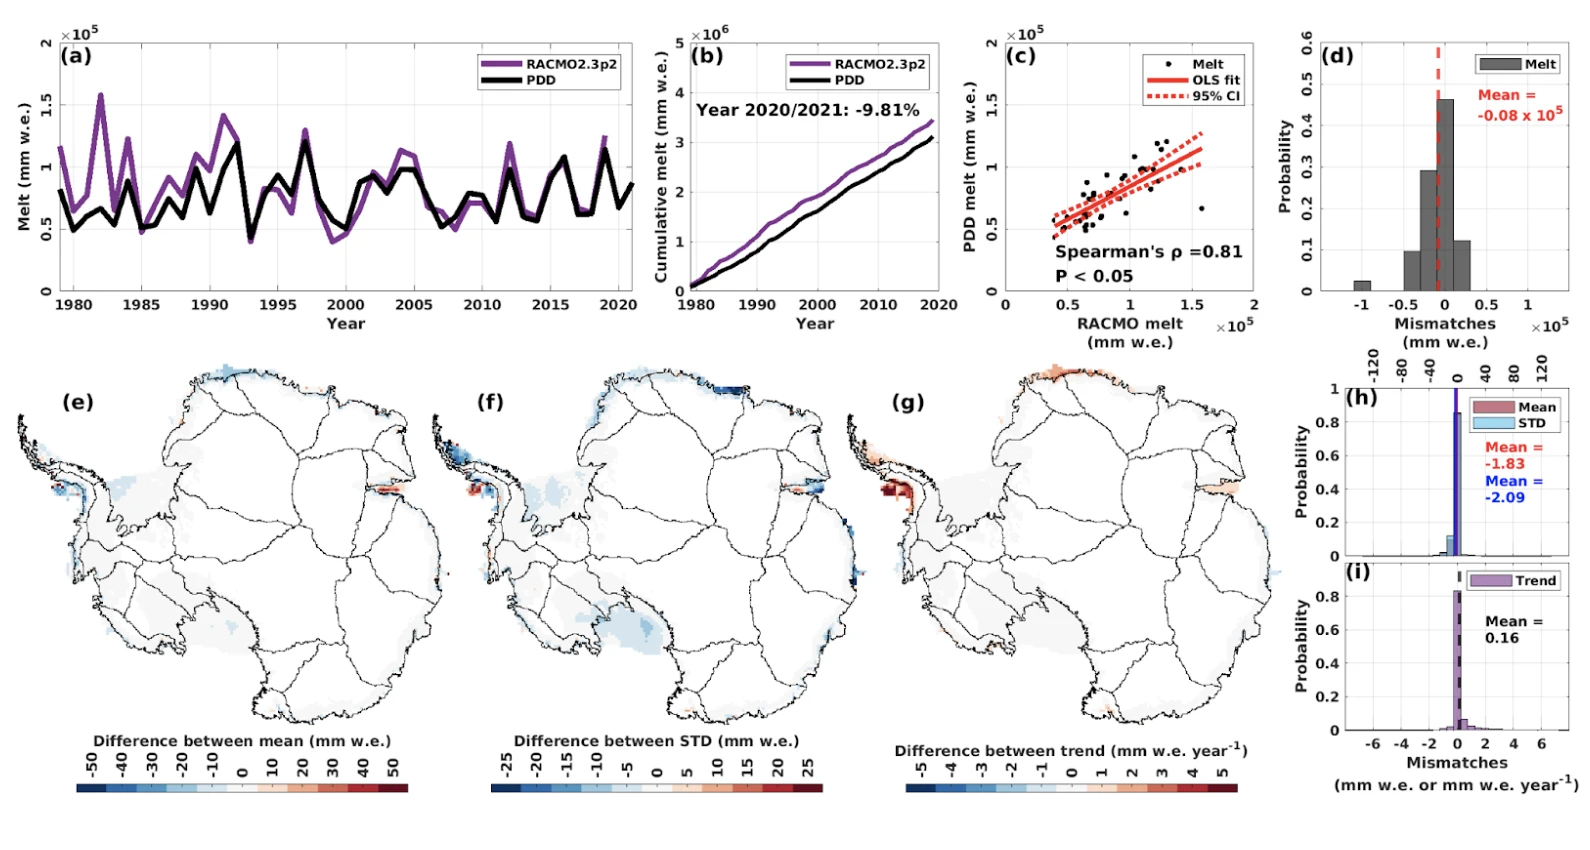
The image above shows:
(a) time series for the annual melt amount (mm w.e.) for RACMO2.3p2 simulations during the period from 1979/1980 to 2019/2020, and for PDD outputs during the period from 1979/1980 to 2021/2022.
(b) cumulative annual melt amount for RACMO2.3p2 simulations and PDD outputs from 1979/1980 to 2019/2020.
(c) scatter plot and ordinary least squares (OLS) fit between satellite annual melt amount and PDD annual melt amount.
(d) probability histogram for the mismatches between the PDD annual melt amount and satellite annual melt amount. Red dashed vertical line indicates the mean of all mismatches.
(e) to (g) spatial maps for the differences between mean, standard deviation (STD) and trend of PDD outputs and RACMO2.3p2 simulations. Mean, STD and trend for the PDD outputs and RACMO2.3p2 simulations are calculated over the period from 1979/1980 to 2019/2020.
(h) and (i) probability histograms for the mismatches between the PDD outputs and RACMO2.3p2 simulations on mean, STD and trend (histograms for (e) to (g)). Red dashed vertical line indicates the mean of all mismatches between means. Blue vertical line indicates the mean of all mismatches between STDs. Black dashed vertical line indicates the mean of all mismatches between trends.
2. We also explore the representation of 2m temperature and surface melt in the Polar-WRF model, at 25 km resolution and 40 vertical levels over the entire continent. We study the temperature-melt relationship, and compare the melt rate product from PWRF to other state-of-the-art models and reanalyses.